Bent connecting rod. VW Crafter 2018 2.0 BiTurbo DAVA
Diagnostics of diesel engines using the Autoscope IV device
The software of USB Autoscope IV automotive oscilloscope allows you to carry out comprehensive diagnostics of the injection systems and mechanics of any diesel or gasoline engine.
It provides detailed analysis by capturing and interpreting waveform signals from engine sensors and actuators, helping technicians accurately identify faults in fuel delivery, ignition timing, compression, and other engine processes. This advanced diagnostic capability makes it an primary diagnostic instrument for modern automotive diagnostics and repair.
1. Introduction
The VW Crafter 2018, 2.0L, was caught in a heavy downpour while driving, the water level sometimes exceeded the clearance of the car.
After this, the engine began to work worse: strong vibrations appeared, and the car lost power. The next day, when starting a cold engine, the shaking became even stronger, and white smoke came out of the exhaust pipe.
When the engine warmed up, the vibration became less, and the smoke disappeared. But then everything repeated itself.
At the service station, diagnostics were carried out. When checking the warmed up engine, the scanner showed that there were problems with the fuel supply in the first cylinder. This could be due to a faulty injector or poor compression.
The presence of white smoke when starting a cold engine means that some of the fuel does not burn and goes into the exhaust.
This information allowed us to conclude that Hydrolocking occurred in the engine. Water gets inside the cylinder through the air intake. Water does not compress like air, and when the piston went up, it hit the water. Because of this, the connecting rod bent, and the piston did not rise all the way.
As a result:
- The combustion chamber has become larger than it should be
- Compression has decreased
- The engine starts worse, runs unstably, and white smoke appears
To clarify the diagnosis, we will conduct additional engine checks.
2. Compression tester
We will measure the compression in the cylinders using a conventional device - a compression tester Figure 1.
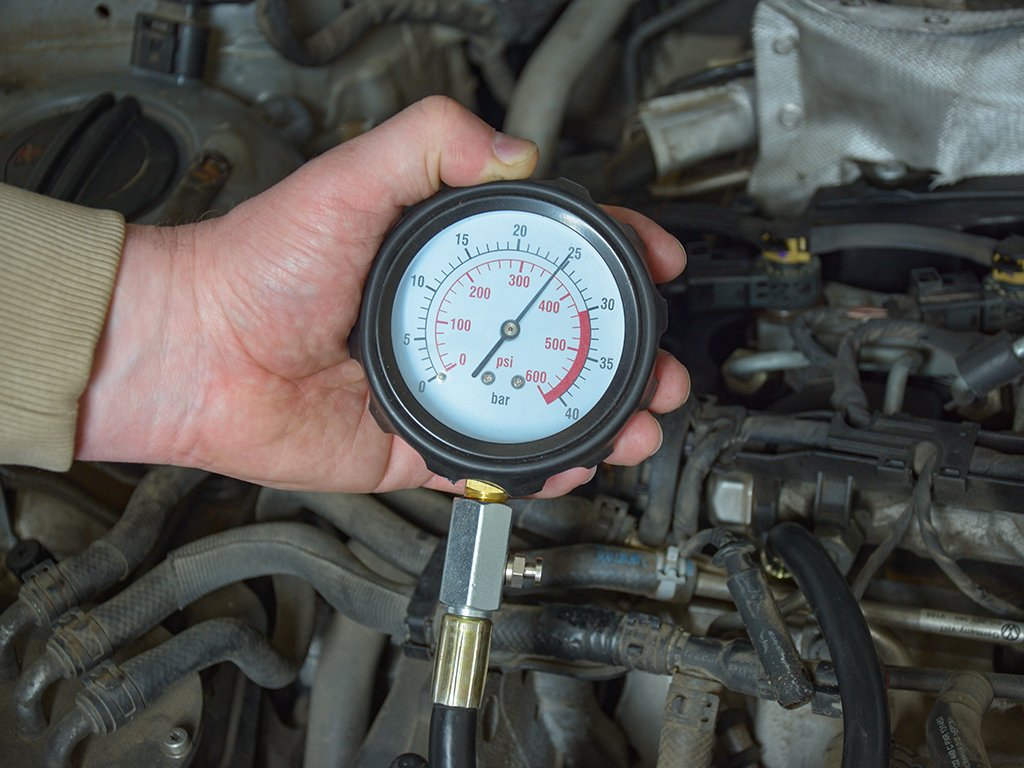
Figure 1. Measurement using a conventional compression tester
This device shows how well the air is compressed inside the cylinder. It is connected to the cylinder and when the engine is cranked by the starter, it measures the maximum pressure that is created when the air is compressed.
Compression measurement results:
| Cylinder number | 1 | 2 | 3 | 4 |
|---|---|---|---|---|
| Compression | 25 Bar | 27 Bar | 27 Bar | 27 Bar |
In the first cylinder, the compression was below the norm - only by 2 Bar, or about 7.5%. This is not a very serious deviation and in itself should not cause problems with fuel ignition.
Test time: more than 1-2 hours.
3. Relative compression test
We will conduct a relative compression test using the Autoscope IV device - Figure 2.
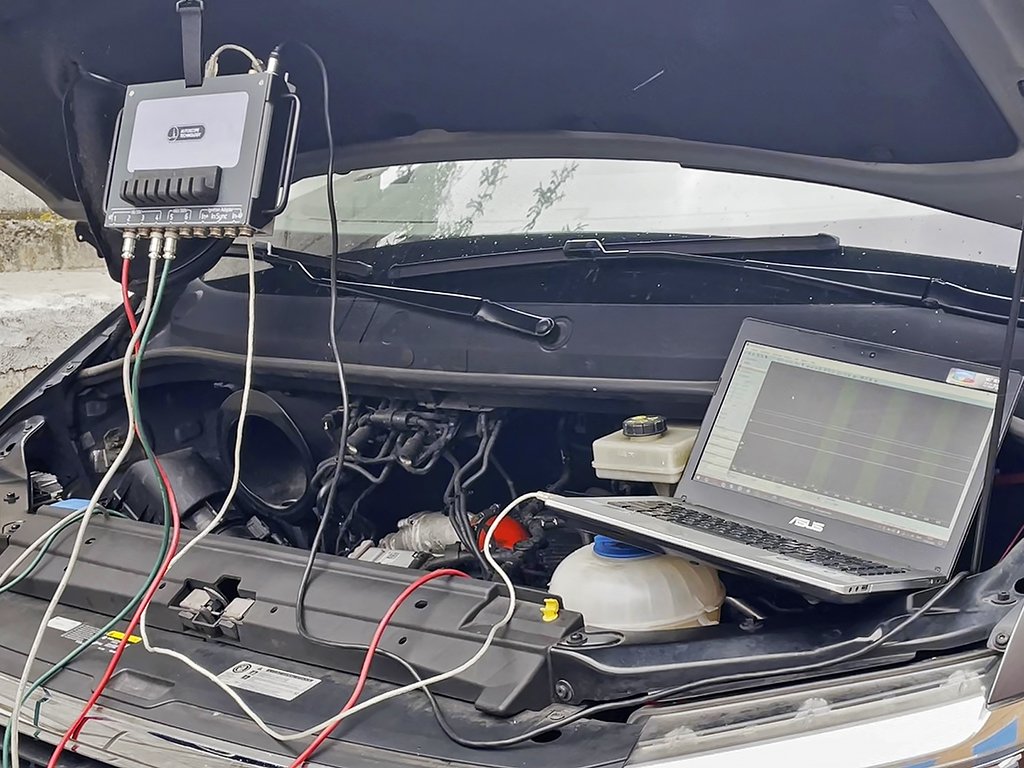
Figure 2. USB Autoscope IV connection
We will use the CTi-1000 current transducer to embrace all the wires emanating from one of the battery terminals Figure 3.
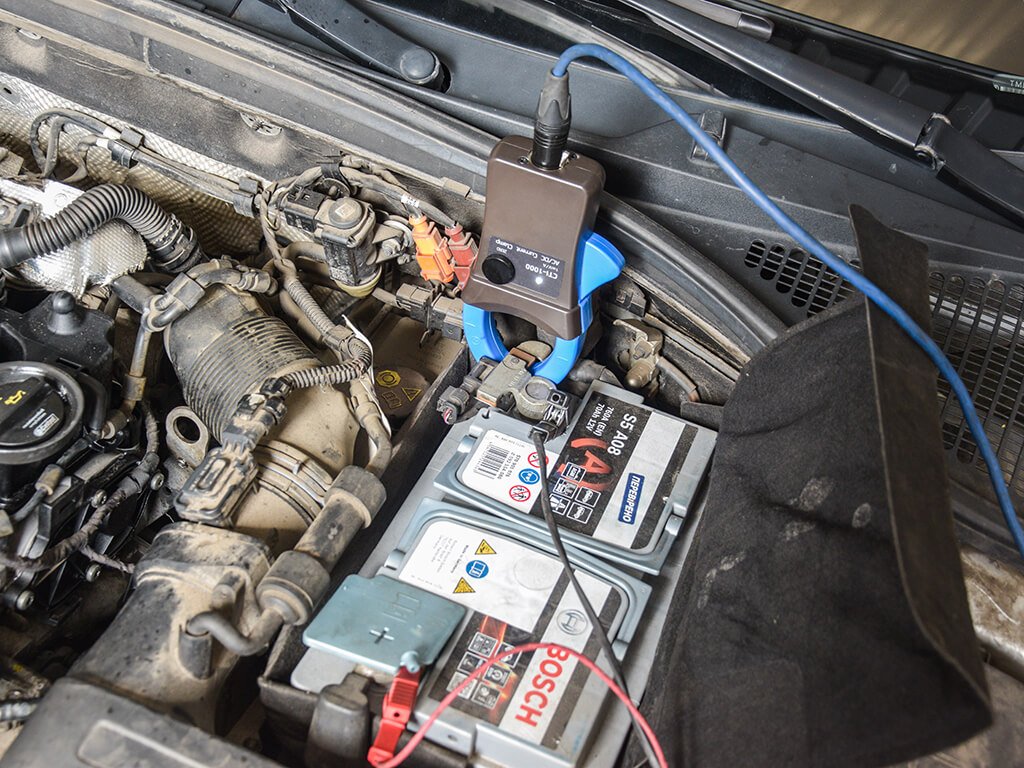
Figure 3. CTi-1000 current clamps
A current clamp will show changes in current while the engine is being cranked by the starter. By analyzing these current fluctuations, it's possible to determine which cylinder has higher or lower compression.
In this form, you can see the measurement result, using the Autoscope IV device - Figure 4 and Figure 5:
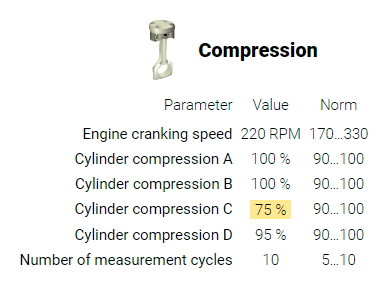
Figure 4. Results of compression measurement
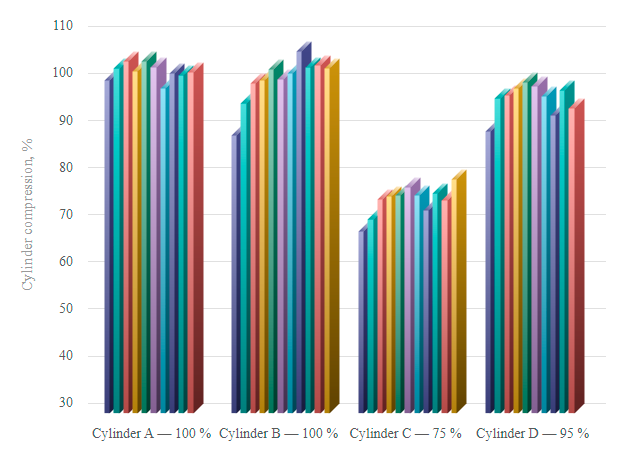
Figure 5. Compression values displayed as bar graphs
The results of the measurements show that in one of the cylinders the compression is reduced by 25%, and this is already a serious problem - such a loss can cause misfires.
Why is this test more accurate than a regular compression tester? The thing is that when using a compression tester, it is connected to the cylinder through several adapters - an adapter, valves and tubes. All this adds extra volume to the combustion chamber, which reduces the measured pressure. Moreover, this reduction is not the same for all cylinders: in those where the pressure was initially higher, it drops more. And where the compression was already lower, it hardly changes. Because of this, the difference between normal and problematic cylinders is smoothed out, and the malfunction becomes less noticeable.
The relative compression test is a great way to quickly compare the operation of cylinders, especially if you need to find one problematic one without wasting extra time.
Test time: less than 10 min.
4. Cylinder balance test (Efficiency tab)
Autoscope Technology has created a special test called CSS script. It consists of several sub-tests.
Unlike the compression test, which is performed when the engine is cranked with the starter and without fuel supply, this test is performed on a running engine - at idle and at high speeds.
It shows how efficiently each cylinder burns fuel, and how this is reflected in different engine operating modes.
The signal from the crankshaft rotation sensor is used for analysis.
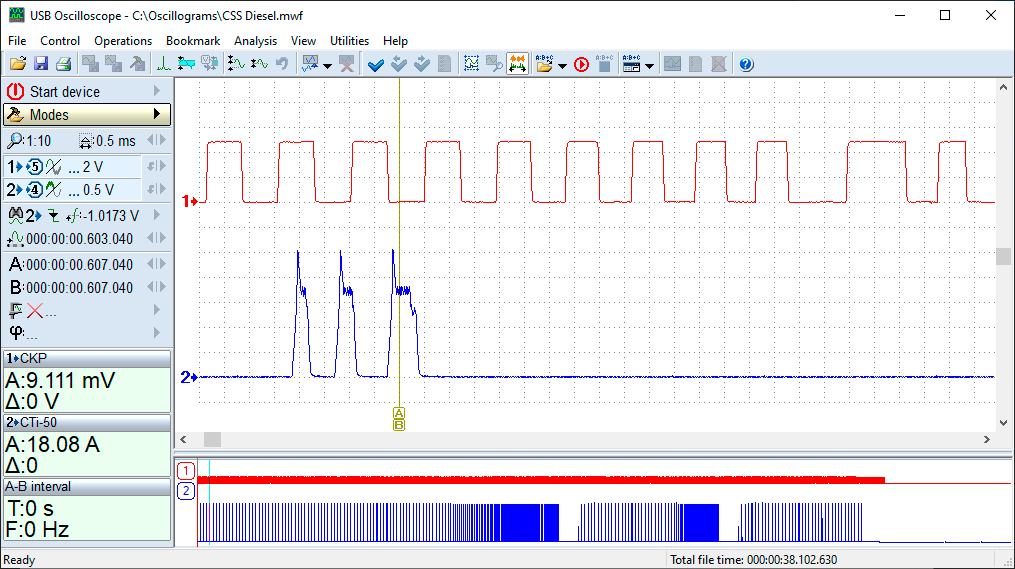
Figure 6. CKP sensor and CTi-50 signals needed to perform CSS test
For synchronization is used a control signal of the injector of the cylinder #1 using the CTi-50 current clamps.
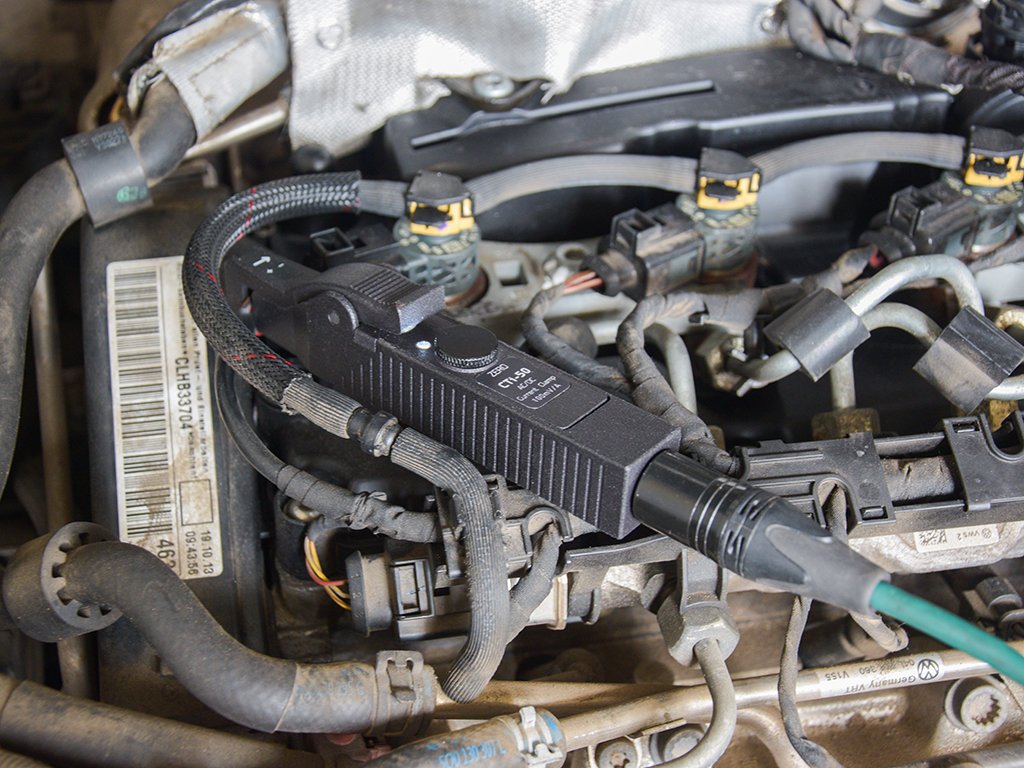
Figure 7. CTi-50 current clamps connection to the control signal of the injector of the cylinder #1
The software records small fluctuations in the crankshaft rotation speed. Compares the operation of the cylinders and plots efficiency graphs.
We will conduct a test of the efficiency of the cylinders on a cold engine, and then on a warmed-up one.
The result of the operation of a cold engine:
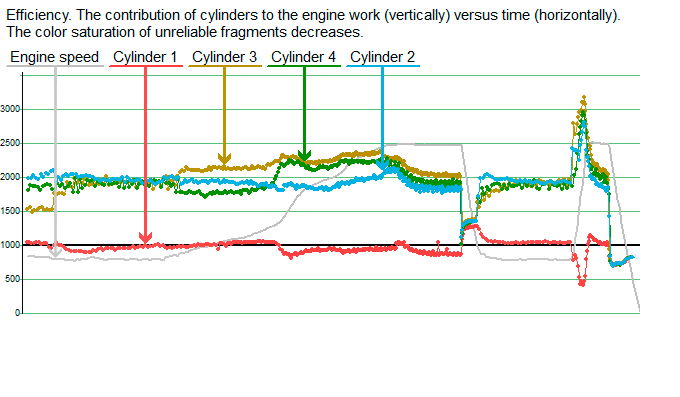
Figure 8. Efficiency graph obtained during cold engine operation
The red graph shows the efficiency of the cylinder #1. This cylinder practically does not work on a cold engine.
On a hot engine the following result was obtained:
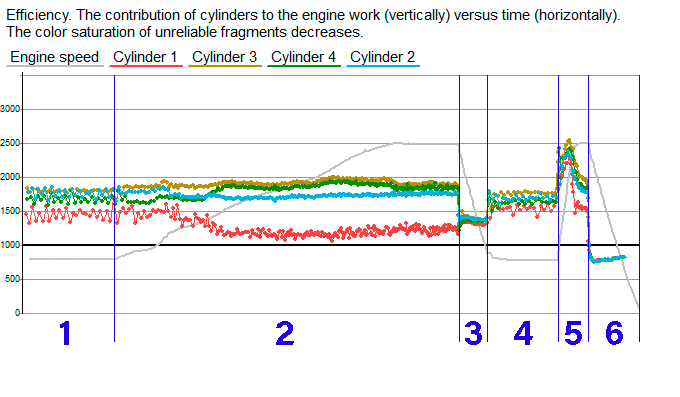
Figure 9. Efficiency graph obtained during hot engine operation
After warming up the engine, the efficiency of the cylinder #1 increased, but not in all modes. Let's consider the test sequence:
- Engine idling
- Smooth increase in engine speed to 2500 RPM
- Reducing speed (engine braking mode)
- Engine idling
- Sharp acceleration (accelerator pedal fully pressed)
- Ignition off (accelerator pedal fully depressed)
After a smooth increase in speed, the cylinder #1 began to work noticeably better than before.
This indicates that even a small increase in temperature improved fuel combustion in this cylinder. This confirms the guess that the compression ratio in the cylinder is reduced - after all, it directly affects the air temperature in the cylinder, and therefore the quality of fuel combustion. When water got into the engine, a hydraulic shock occurred, but not strong enough to completely disable the cylinder.
Cylinder #1 continued to work, but with problems - such failures are the most difficult to diagnose, because it is very difficult to clearly identify the malfunction.
An interesting point: when the engine was already warm and the revs were gradually increasing, cylinder #1 stopped working altogether 2. Why? Because in this mode, more fuel was supplied to the cylinder, but almost as much air as at idle. The turbine had not yet turned on, and the boost pressure was not enough. In other cylinders, this was enough for ignition, but not in the first one, because the air is compressed worse there, and its temperature is lower. Because of this, the fuel did not have time to warm up and ignite - the cylinder simply stopped working. This is also visible on the graph: with a sharp increase in revs, the curve for cylinder #1 went in the same direction 4 as for the others, but was lower. This means that the cylinder participates in acceleration, but gives less power than the others.
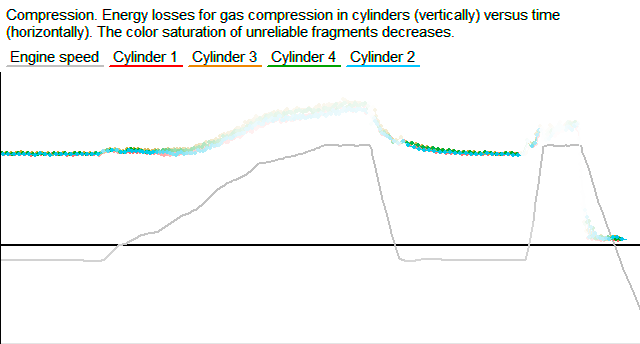
5. Compression tab
In addition to the "Efficiency" tab, which shows how the engine accelerates after the fuel in the cylinders has burned, the CSS test has another important tab - "Compression". It shows how the engine slows down when the piston compresses air before the top dead center (TDC).
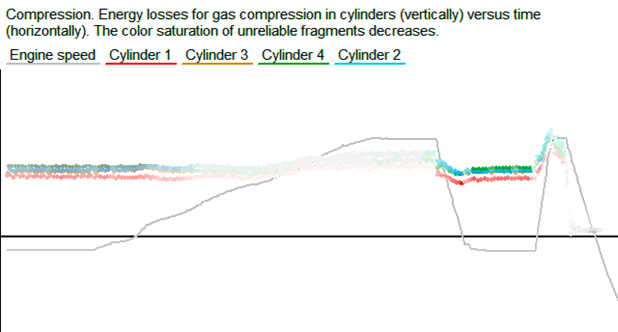
Figure 10. Compression tab - how the engine slows down when the piston compresses air before the TDC
The graphs in this tab show how much energy is spent on compressing the air in each cylinder. The higher the compression in the cylinder, the more energy is needed to compress the air. Therefore, these graphs can be used to compare how well the air is compressed in each cylinder. In our case, we can see that the graph for cylinder 1 (marked in red) is below all the others - this means that the compression in it is low.
The CSS test not only helped to detect the problem with the compression ratio, but also to show exactly which cylinder it is in and how it affects the engine operation.
6. Conclusion
Engine characteristics before repair:
Figure 11. Results of compression measurement
Figure 12. Compression values displayed as bar graphs
Engine characteristics after repair:
Figure 13. Results of compression measurement
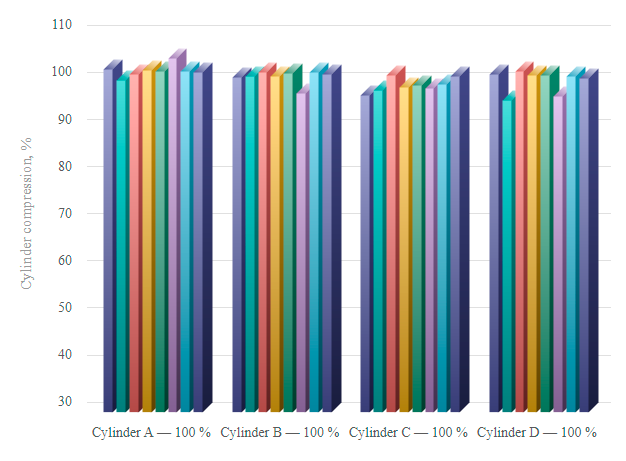
Figure 14. Compression values displayed as bar graphs
Engine characteristics before repair:
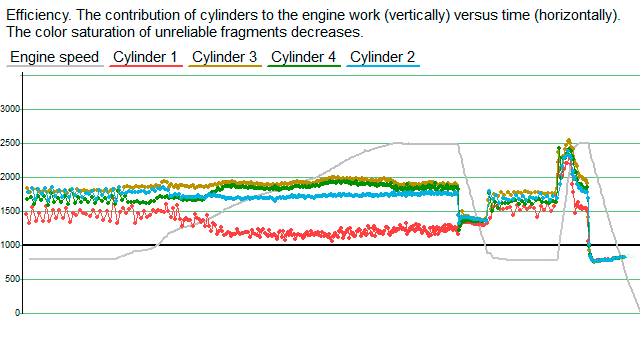
Figure 15. Efficiency graph obtained before repair
Engine characteristics after repair:
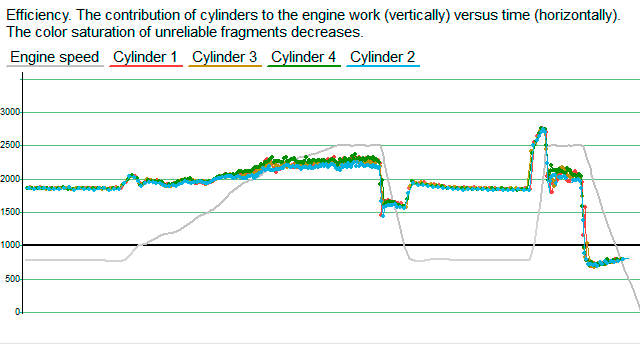
Figure 16. Efficiency graph obtained after repair
Engine characteristics before repair:
Figure 17. Compression tab obtained before repair
Engine characteristics after repair: