USB Oscilloscope v4.6.5.63 beta
Language support
Currently, USB Oscilloscope v4.6.5.63 Beta has 10 languages available.
We added support for Czech, French, Polish, Slovak and Ukrainian languages.
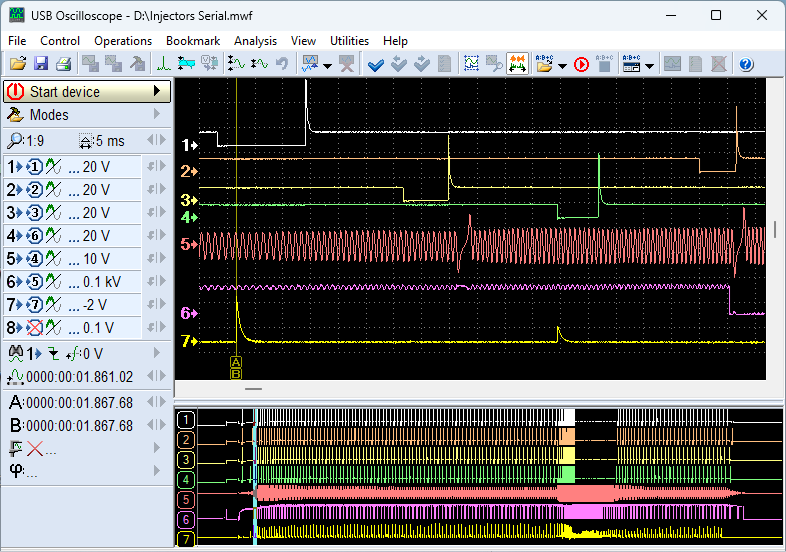
Preview Window
The program has a built-in preview window for the entire recording. Unlike the main signal viewing window, which displays only a fragment of a detailed waveform image, the preview window shows a miniature version of the waveform. This makes it possible to display the entire signal from the beginning of the recording to its end.
At the same time, the preview window also serves as an additional tool for selecting signal fragments to display in the main window. Users can select the fragment they wish to view in detail by highlighting the desired section of the miniature waveform with the mouse pointer, which simplifies navigation through the recorded signals.
Waveform stretching
The main signal viewing window, in addition to the ability to compress waveforms horizontally, now also allows them to be stretched. Due to this, the user can now examine small details of waveforms in greater detail.
Signals can be stretched not only by using the "Time/Division" control (hotkey: "Ctrl + '+'"), but also by selecting a narrow fragment of the waveforms with the mouse pointer in the main signal viewing window and then pressing the "Auto zoom" button located on the toolbar.
Smooth Zooming
In previous versions of the program, the horizontal zoom could only be set to values in multiples of 1, 2, 5, and so on. Now, the program allows zoom to be set to any whole number from 1 to 500. In practice, this means the horizontal grid step of the oscilloscope can now be adjusted smoothly.
PSI pressure units
To make use of the AUTOSCOPE TECHNOLOGY pressure transducers as simple as possible in many regions and to be guided by the customs and preferences of the users, we added PSI pressure units in our software.
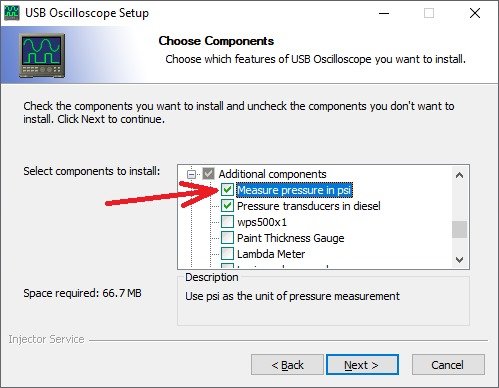
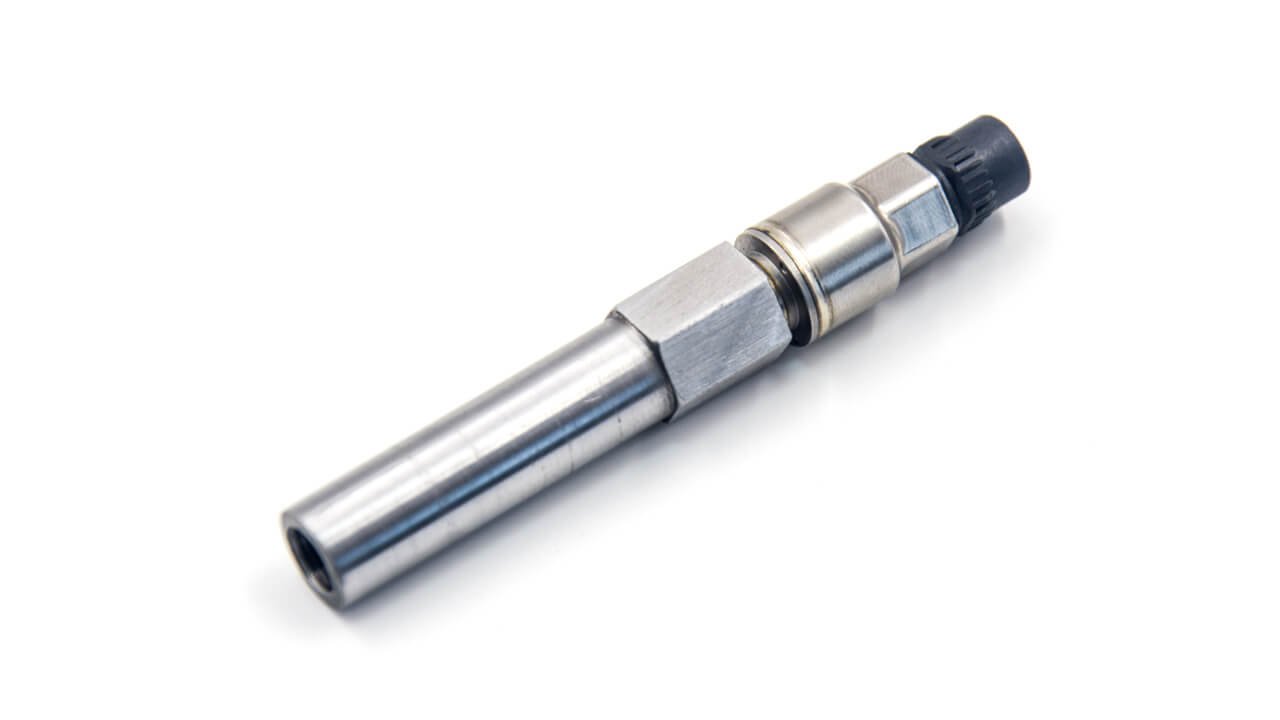
Psg200 pressure transducer support
In a new version of USB Oscilloscope software we added support of Psg200 pressure transducer designed to capture the pressure graph in a diesel cylinder.
You should specify support of this transducer during sofware installation. After making all connections, call the menu "Modes => Psg200" and start the engine - the screen will automatically display the pressure graph in a convenient form and a mask of characteristic points of the diesel pressure graph.
As soon as the user stops recording the signal - the analyzer panel will load, which will also automatically find pressure peaks and set a mask in the idling section.
X-Y Analyzer mode
We added X-Y analyzer mode to our software making USB Autoscope capable of displaying voltage-versus-voltage by using "X-Y mode". Useful application of X-Y mode is to plot the I-V characteristics of a semiconductor device.
The inputs of the oscilloscope are configured to show the current and the voltage respectively, and the result is a perfect plot of the device’s I-V curve. The best part is that it’s designed for in-circuit measurement, allowing it to be used for fault-finding.
Dedicated instrument that perform such measurements is known as Curve Tracer, but now we can also perform the same task and make the same measurements by using USB Autoscope engine analyzer.

Horizontal Markers
In previous versions of the program, users could only use vertical markers A and B (hotkeys: "Shift / Ctrl + Mouse Click") for manual measurements. Now, the control panel includes a new feature, the "Action Channel Control". This allows users to add horizontal markers V and Δ for the selected channel, providing an alternative method for performing manual measurements.
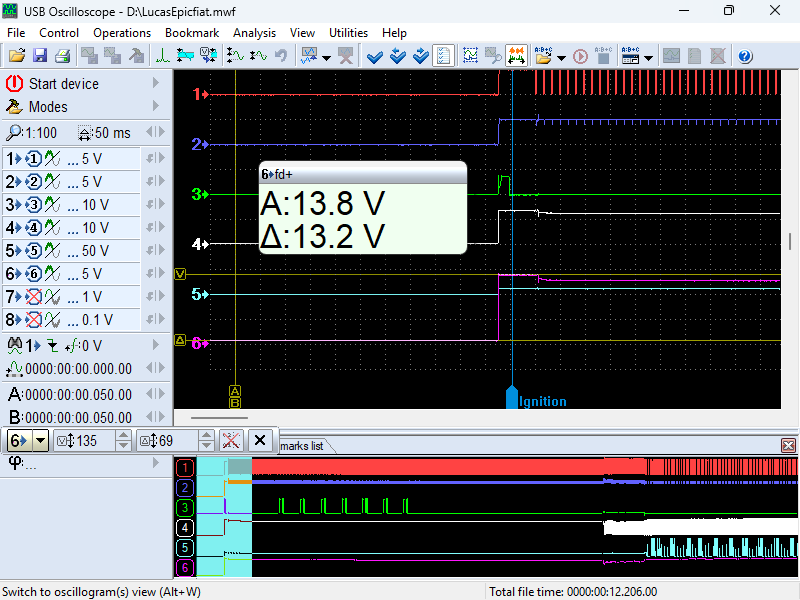
Vertical Scale
For the channel selected by the user in the "Action Channel Control" menu, a vertical voltage scale can be activated. This makes it easier to visually assess the signal amplitude and the position of the horizontal markers.

Button: "Convert V(Δ) Marker(s) to Level (Range)"
This button is located on the toolbar and allows the position of horizontal measurement markers to be converted into a level or range marker (depending on the number of horizontal markers used). This feature can be useful when analyzing signal amplitude deviations from the required level.

Probes Manager
Probes Manager (hotkeys: "Alt + T") allows users to manage the list of sensor names displayed in the dropdown menu of the channel settings panel and the context menu of the measurement panel indicator. This enables users to shorten the list, keeping only the sensors they regularly use during measurements.
If the user opens a waveform file where, for example, a channel is assigned a sensor name that has been disabled in the manager, the formula for converting the output voltage of the signal into the physical quantity measured by the sensor will still be applied automatically. Thus, Probes Manager does not limit the program's functionality but simply allows the user to customize the dropdown list of sensor names to match their needs.

Formula Creator
Custom probes setup menu (hotkeys: "Ctrl + V") has been enhanced with a "Formula creator" button, simplifying the process of adding support for non-standard sensors in the program. As before, when adding a new sensor, the user must enter the sensor's name and the unit of the physical quantity it measures in the corresponding fields of the "Sensor Settings" window.
However, the formula for converting the sensor's output signal voltage into the measured physical quantity can now be generated using the "Formula creator" button. This feature is exclusively for sensors with a linear output characteristic. In such cases, the user only needs to fill in the value table in the "Linear Formula creator" window and click OK. The formula will then be automatically generated and entered into the appropriate field in the "Custom probes" window.