Simple answers to difficult questions
As cars evolve with advanced technology, the quantity of electronic units, sensors, and actuators continues to grow. However, control modules might not detect all faults. To accurately and effectively diagnose issues, it may be essential to use data from a DMM or an oscilloscope.
Introduction
It is said that the entourage makes the King. Similarly, we can say that the equipment a technician uses defines him or her. This is often the opinion of customers getting their vehicle serviced or repaired. The more expensive the tools and tool boxes are and the more instrument cases with equipment customers see in the shop, the higher they rate the technician. The customers look at all the fancy equipment and think to themselves: “This technician must be a true professional, just look at all that equipment.” Then they say: “Please find out what is wrong with my car (oh sage one).”
Customers soon enough learn that the expensive equipment and fancy tool boxes do not in themselves lead to correct diagnosis and repair. A good diagnosis and repair relies on the experience, knowledge, flexibility of mind and logical thinking skills of the technician. In many cases, when making decisions about diagnosis and repair, in addition to the technician's skill and understanding, it is important to have data from several sources. These sources may include a scanner, an engine analyzer or oscilloscope, maybe even a smoke machine and pressure tester. It may be necessary to have a large fleet of test and diagnostic equipment which carries with them a substantial and in some cases, ongoing cost. Is there possibly another solution for some of these diagnostic dillemas?
Working at an authorized service center I have the opportunity to use some engine analyzers, but in practice I often use a tool called the USB Autoscope.
The reason it is my “go to tool” is due to it's small size, simplicity, ease of use, and the manner in which the software processes and displays the signals. Using additional scripts such as the CSS, Px and EIPower scripts some diagnostic tasks are greatly simplified and more accurate than using other methods. The remainder of this article will show some examples of simple troubleshooting in complex systems using the USB Autoscope.
BMW 525 xDrive E61 N53
The first vehicle is a BMW 525 xDrive E61 N53 where the complaint is poor performance until the engine is warm.
The engine N53 (for example, N53B30O0) is based on the earlier N52 engine. The N53 as well as the N54 engine is equipped with direct fuel injection. The N53 engine does not contain a variable valve lift system (Valvetronic). The N53 engine can operate with a wide range of stratified lean mixtures where Lambda can go as high as 2.5. (If we assume 14.65 as a stoichiometric air/fuel ratio a Lambda of 2.5 equals 14.65*2.5= 36.7 AFR. The six-cylinder engine is designed for the European market and has one catalytic converter to reduce Nox.
The engine utilizes High Precision Injection (HPI) which controls timing, amount, and number of injection events. The system can inject fuel 3 times per stroke and controls the stratification of the fuel charge in the combustion chamber.
The system has a very positive influence on the power, torque, fuel consumption and emissions of the engine. BMW calls this strategy EfficientDynamics.
Theory aside, the problem vehicle did not run smoothly cold and would sometimes stall. Once warmed up, all driveability concerns disappeared. The reason for the problems was fairly easy to discern; the engine was running way too rich and the fuel trims would go as far as -28%, The mixture problem was confirmed by the use of a gas analyzer. Finding the reason for the rich condition proved more difficult. Three different scanners displayed very limited information. Checking the MAF, ECT, and the operation of the variable valve timing system found them all operating as designed.
There was a possibility that the fuel pressure sensor was reporting lower than actual pressure. The fuel pressure was tested after the low pressure pump and found to be 5 Bar (73 psi), which is within specifications. The fuel pressure was also tested at one of the injectors and found to be 150 Bar (2200 psi), again within specifications and coinciding with the readings on the scanner. Now what?
In order to understand why the injectors are injecting more gasoline, to find out if the reason is internal to the injectors or caused by an external signal, the electrical injector pulse width was measured. The injection was performed at the end of the intake stroke two times with a duration of ~0.5 ms. Figure 1 shows the injection control signals represented as voltage and current. Figure 2 is a zoomed in waveform of the injection control signals. The waveforms do not show any problems with the injector drive system.
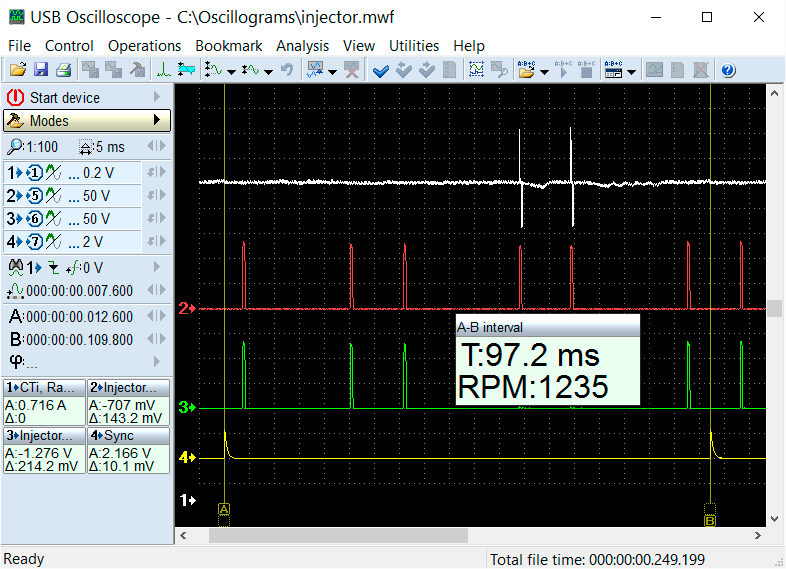
Figure 1. Injector waveforms on problem vehicle

Figure 2. Zoomed injector waveforms on problem vehicle
Attention was paid to the fact to the fact that the correction coefficients or fuel trims for the two groups of cylinders are slightly different. If STFT on B1 =-28% and LTFT B1 = -19%, then the STFT B2 =-20% and LTFT B2 = -12%. This means that the enrichment on bank 2 is less.
Using the CSS script on the USB Autoscope and recording the efficiency graphs on a cold engine showed that cylinders #5 and #6 (graphs of yellow and blue colors) were less efficient as can be seen in Figure 3.
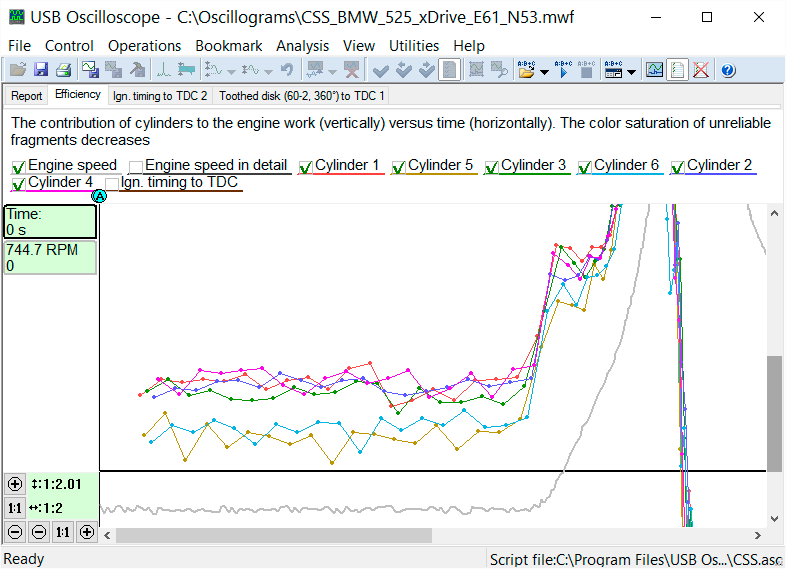
Figure 3. CSS efficiency graphs with the engine cold
As can be seen in Figure 4 with the engine warmed up the cylinder efficiencies are much more uniform. Scan tool data also showed that the fuel trim values adjusted to close to zero on both banks.

Figure 4. CSS script graph from the problem vehicle with warm engine
Note that to run the CSS script with cylinder identification a synch signal is necessary. This engine implements multistrike ignition where the mixture is ignited by a single spark and an additional spark is generated approximately in the middle of the stroke. For this reason, a primary ignition signal could not be used for synchronization. However, a secondary ignition signal can be used, because the amplitude of the subsequent strikes are much lower than the amplitude of the initial strike. Figure 5 shows the synch signal obtained from the secondary side of the ignition coil using a normal plug wire as an extension. (This engine uses COP)
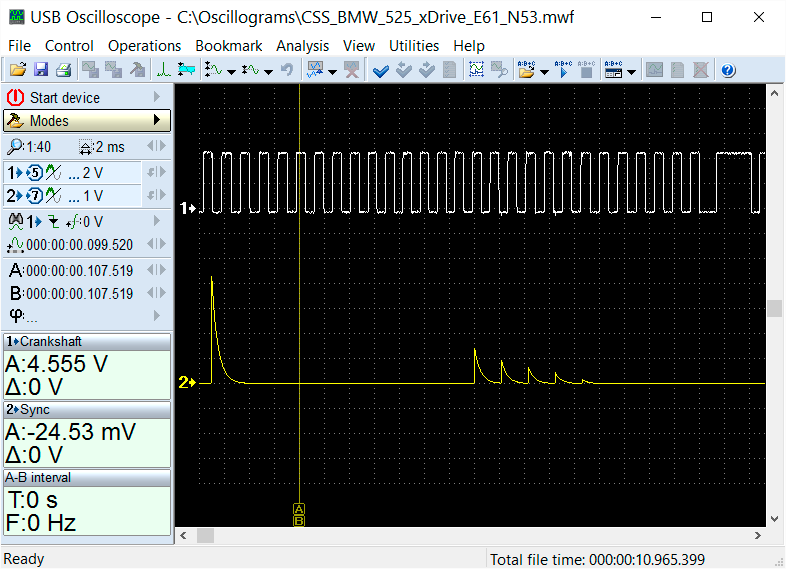
Figure 5. Secondary ignition synch signal
By using the efficiency graphs from the USB Autoscope's CSS script along with the fuel trim values shown on the scanner, it was concluded that the injectors on cylinder #1, 2, 3, and 4 delivered excessive amounts of fuel when cold. As the injectors warmed up, close to normal operation was restored. Replacing the injectors restored normal engine operation.
Audi A6 3.2 FSI BYU
Our next problem child is an Audi A6 3.2 FSI BYU. This vehicle exhibited the opposite problem from the BMW in the first case. When cold the engine ran fine, but when warm the engine was running too rich. The scanner showed that the engine control system was setting two codes:
- 004407 (Bank 1; Mixture Adaptation at idle)
- P1137 007 (System too Rich)
To diagnose the problem, the CSS script's efficiency tab was again used, along with scan tool data. The fuel trims were LTFT B1 = - 47%, STFT B1 = - 9.4%. The LTFT on B2 was = - 36% and the STFT B2 was = + 2.3%.
A way to measure crankshaft angular velocity is necessary for the CSS script to operate properly. However, it was difficult to gain access to the signal from the CKP sensor, due to the way the sensor and the connector at the PCM is designed. The USB Autoscope does provide for the use of an external optical laser as an engine speed sensor. It is necessary to create some way for the laser sensor to read the crankshaft velocity. One way that works well is to attach a printed marker disc. This disc can be easily made using a printer and an example of a disc is shown in Figure 6.
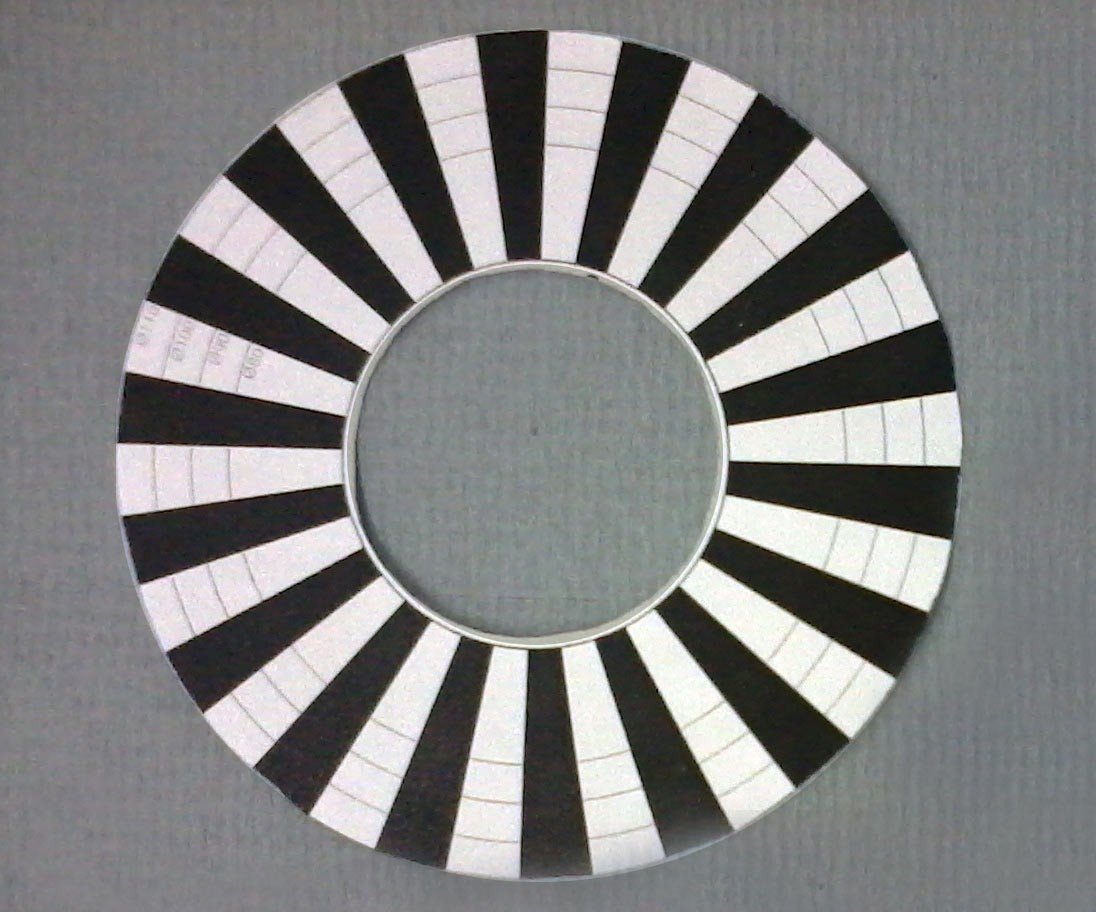
Figure 6. Disc used with an optical sensor to generate engine speed signal
Figure 7 shows that the effciency tab of the CSS script has cylinder #2, bank 1 as most efficient and that cylinder #5, bank 2 is the least efficient.
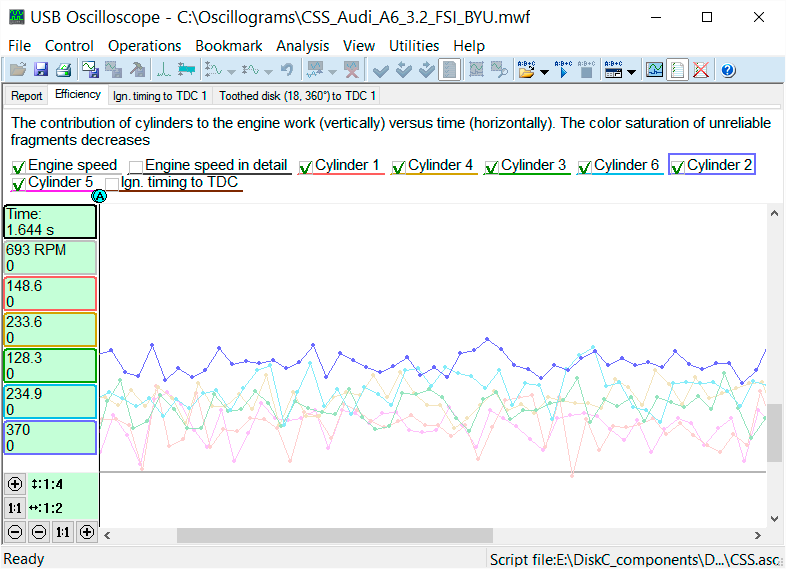
Figure 7. The efficiency tab of the CSS script.
Figure 8 also shows that cylinder #5 is occasionally misfiring.
Seeing such a large variation of the cylinders efficiency with a strong enrichment of the fuel-air mixture, the suspicion was leaking fuel injectors. To test this assumption without removing the injectors, a gas analyzer was used.
The engine was warmed up and shut down. One spark plug at a time was removed and the probe from a gas analyzer inserted in the spark plug hole to measure the HC content directly in the cylinders. In cylinder #5 HC content did not exceed 200 ppm, but in cylinder #2 the analyzer was over ranging at more than 9000 ppm. In the other cylinders the HC level was between 3000 and 7000 ppm. It was obvious that the injectors were leaking in all the cylinders except #5 with #2 being the worst. Cylinder #5 would misfire because the PCM would attempt to lean out the mixture with the result that #5 became too lean to sustain proper combustion.
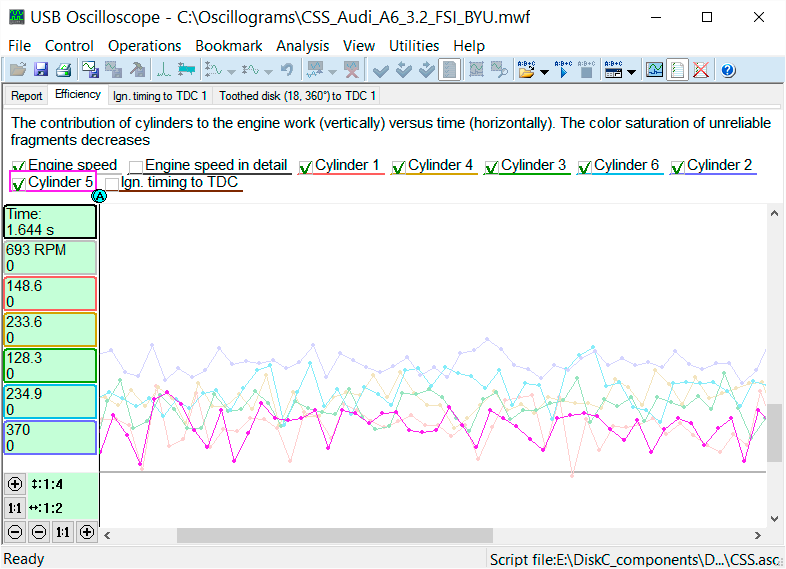
Figure 8. The CSS shows that cylinder #5 is occasionally misfiring
The injectors were removed from the engine and installed on a test bench. Once the fuel pressure approached 3.0 Bar (44 psi) the injectors would start leaking. When new injectors were installed on the engine the fuel trims remained within a range of ±4%.
Lexus RX300 3.0 V6 1MZ FE
Our final case is a Lexus RX300 3.0 V6 1MZ FE with a customer complaint of rough running. This engine is equipped with VVT.
A scan for trouble codes showed the following DTCs with no obvious problems in the data stream.
- P0300 – Random/Multiple Cylinder Misfire Detected
- P0302 – Cylinder #2 Misfire Detected
- P0304 – Cylinder #4 Misfire Detected
- P0306 – Cylinder #6 Misfire Detected
The 1MZ-FE is a V6 engine. Cylinder bank #1 contains cylinders #1, 3 and 5, bank #2 contains cylinders #2, 4 and 6. During testing it became clear that the misfires occurred intermittently. The engine would run smoothly for a period, then misfire. When the engine was running rough, the misfires occurred on the cylinders in bank #2, as evidenced by the DTCs. Checking of the ignition system showed problems in the secondary or high voltage circuit of the ignition system for cylinders #2, 4 and 6. An example of the problem is shown in Figure 9.
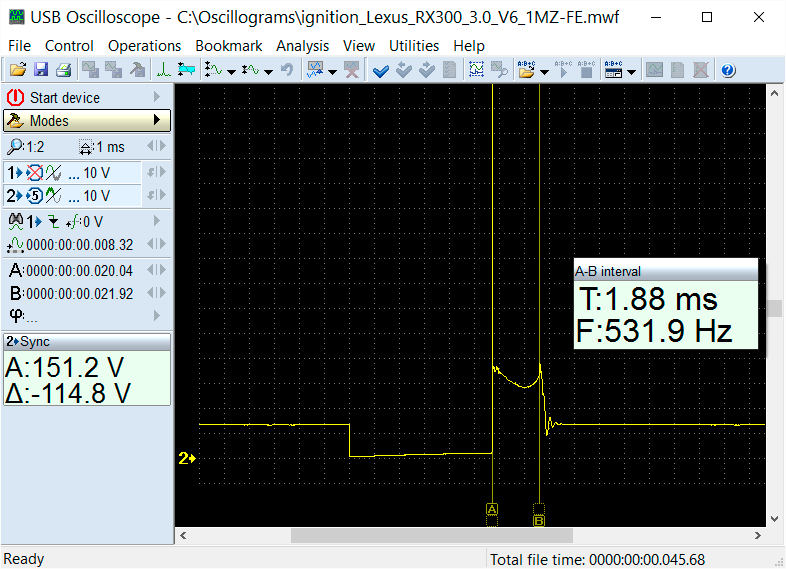
Figure 9. Ignition system problem common to cylinder #2, 4, and 6
The three cylinders with a problem are on the same cylinder bank and shares VVT components. A reasonable assumption would be that the problem is caused a common, shared system. The USB Autoscope software allows you to check how the VVT system operates.
The "Phase" tab of the CSS script, among other things, can display the interaction of camshaft timing relative to the Crankshaft Position Sensor signal. Four waveforms were recorded to perform this test. The waveforms are shown in Figure 10.
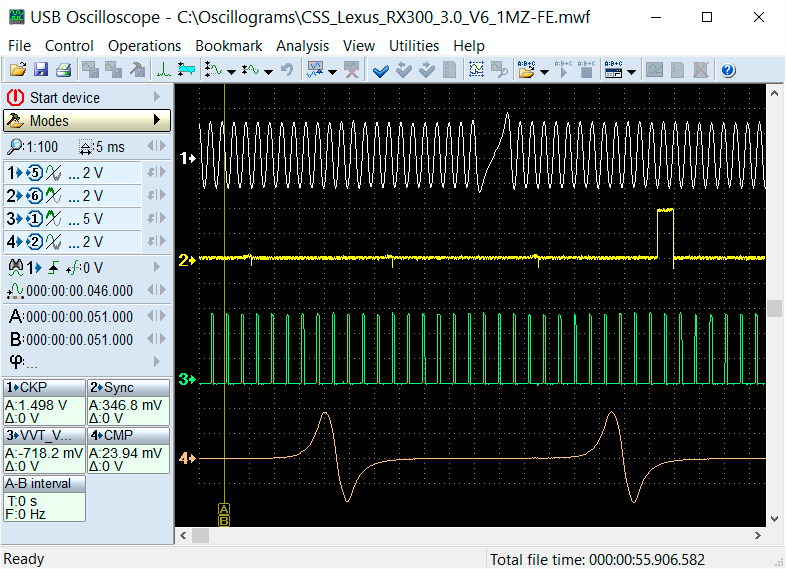
Figure 10. Waveforms recorded to perform valve timing tests
After executing of the script we see how the CMP signal moves in relation to the CKP, and how the control signal applied to the VVT system changes. Figure 11 shows these data in a raster or “waterfall” form. It is seen that the VVT control changed, but the CMP position relative to the CKP did not change.
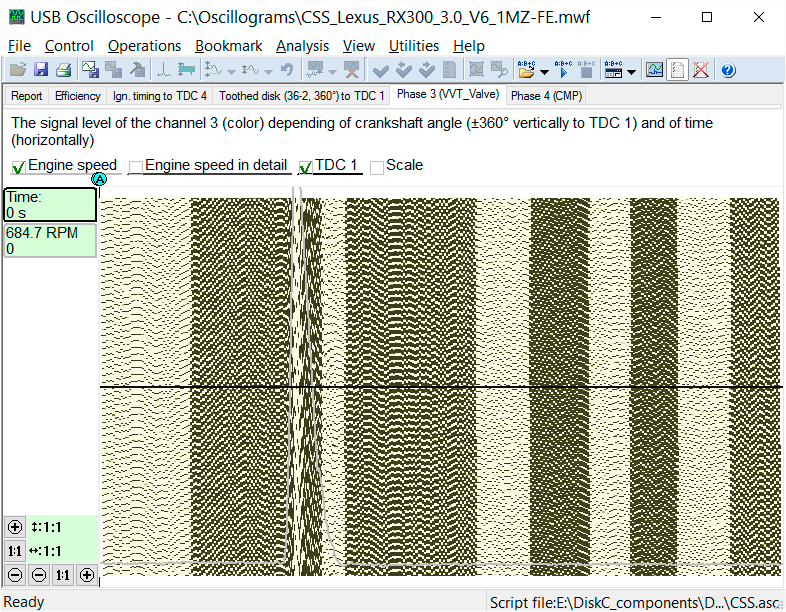
Figure 11. Raster representation of the signals from Figure 10
Figure 12 shows the CMP/CKP relationship versus engine speed. The problem is intermittent.
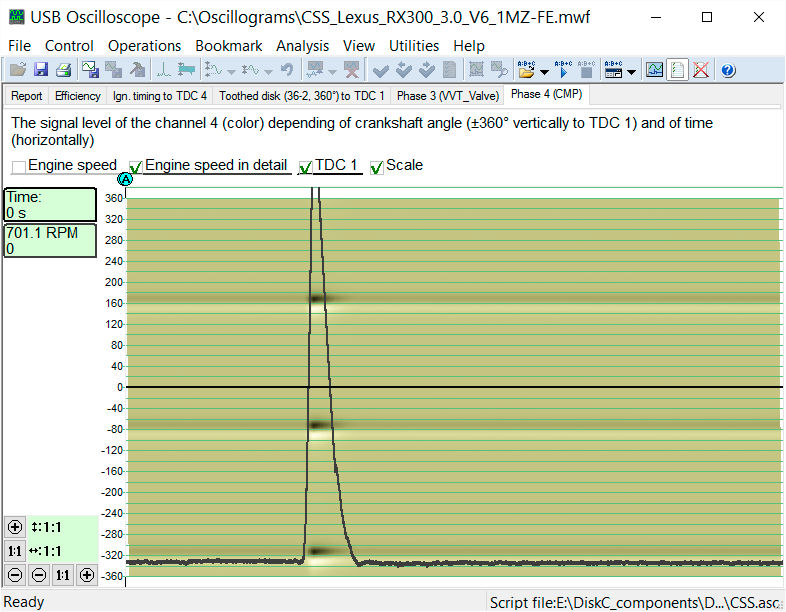
Figure 12. CKP/CMP relationship versus engine speed
The test was performed several times to prove out that the problem was, in fact, intermittent. In each case the electrical signal was as expected, so the final diagnosis was that the problem is mechanical or hydraulic. The VVT actuator was replaced and the problem did not return.
The information obtained with the help of the USB Autoscope was not the only information used, but was decisive in arriving at the correct diagnosis with little time and effort.
Summary
In closing, it should be noted that due to the "Phase" tab's "smart" processing of the original signals, CSS script allows you to greatly simplify and speed up the analysis of waveforms taken from a variety of sensors and actuators of gasoline or diesel engines. This makes it possible to quickly identify both permanent and short term deviations of repetitive or periodic signal's phase, amplitude and duration.
Authors:
Sergey Vorsin
Vasyl Postolovskyi
Olle Gladso