Manual - CSS script
The signal from the crankshaft position sensor contains a lot of information about the engine. When the engine is operating, the engine pistons push on the crankshaft journal, that is why the crankshaft briefly accelerates after top dead center on the expansion (or combustion) stroke. If the fuel did not ignite in the cylinder there would no acceleration. The crankshaft would decelerate instead. Thus, the power contribution from each cylinder can be determined by observing crankshaft acceleration and deceleration.
Even if the engine control unit continuously adjusts the speed of the engine RPM at idle in order to maintain speed in a specified range, the acceleration and deceleration from the engine cylinders are present.
Introduction
The signal from the crankshaft position sensor taken together with the ignition signal from the timing cylinder (usually cylinder number 1) contains information about a significant number of engine parameters
Analysis of these signals allows us:
- to evaluate the static and dynamic compression for each cylinder
- to identify faults in the ignition system
- to evaluate the condition of the injectors
- to obtain information about the ignition timing
- to identify the rotational characteristics of the reluctor wheel
- to identify missing and bent teeth of the reluctor wheel

The signal from the speed/position sensor for the engine crankshaft together with the ignition timing signal can be recorded using the USB Autoscope and then analyzed using the script "CSS" (CSS is an acronym for Crank Shaft Sensor)
In order to perform analysis, the CSS script needs a signal from the crankshaft position sensor and a timing signal from the ignition point in one cylinder.
The "Report" Tab
The first tab of the report gives some initial information in a text based format. In the first line of any given tab the name and version of the script analyzer is given. This helps to ensure that the latest version of the software is used.
The results of the analysis run by this script are then displayed:
Number of teeth per revolution of the CrankShaft: – formula of reluctor wheel, that works together with rotation speed / position crankshaft sensor.
For example, 60-2 means, that disk has 60 teeth, with 2 missing.
FORD often uses flywheels with formula 36-1;
new diesel VOLKSWAGEN – 60-2-2,
SUBARU – 36-2-2-2;

if the signal is recorded from a CKP Sensor using the flywheel ring gear there will be no gaps and there will usually be 136 teeth.
TDC of the cylinder 1 coincides with the tooth number – number of teeth away from the marker tooth. This tooth may be located directly opposite the speed sensor/crankshaft position sensor when the piston of the timing cylinder is at top dead center. The TDC may also be given as the number of teeth away from a missing tooth (signal), If a missing tooth is found on the crankshaft reluctor wheel, then the application calculates the number of teeth away from the missing tooth to TDC 0° of the timing cylinder. If there is no teeth missing, then first tooth will be the tooth that is situated 180 degrees away from the crankshaft position sensor when the piston of the first cylinder is at TDC. It should be noted that the accuracy of the number of teeth on the passage of teeth before TDC depends on the accuracy of the user specified initial ignition timing.
Also in this tab different tips for the technician as well as error messages may be displayed.
The “Efficiency” Tab
In the "Efficiency" tab a graph of the frequency of crankshaft rotation and graphs of effectiveness of each engine cylinder is shown.
The gray graph shows the instantaneous frequency of crankshaft rotation. The higher engine speed is, the higher on the screen the graphics will be placed.
Colored graphs show the effectiveness of each engine cylinder. The higher the acceleration graphics is, the more powerful the cylinder is. A cylinder which does not work at all, creates a crankshaft slowdown, resulting in a graph that is below the black horizontal axis.

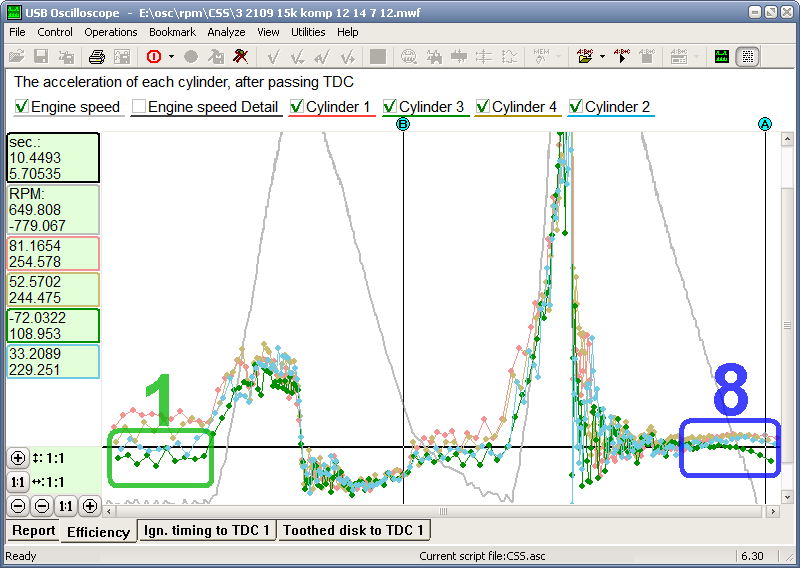
Different modes of the engine work in the "efficiency" tab
During this recording, the engine initially was operating at idle 1 , the electrical connector from individual coil of 4th cylinder 2 , was disconnected, and then reconnected 4 . The graph of efficiency of 4th cylinder dropped below the black horizontal axis 3 .
Then the throttle was smoothly opened 5 – on the efficiency graph is shown that the power contribution from each cylinder increased as the throttle was opened. Then the throttle was then abruptly closed 6 – the power contribution from each cylinder dropped below the zero line.
After decreasing frequency of crankshaft rotation, the engine continues to run at idle speed 6 . Then the throttle was abruptly opened 7 , each of the cylinders increase crankshaft acceleration, efficiency graphs now significant increase.
As soon as the engine speed reached 3000 RPM, the ignition was turned off, but the throttle is held in a fully open position 8 until the engine is completely stopped. As soon as the ignition is turned off, the speed of the crankshaft starts to decrease. At this pint the engine is operating as an air pump. The engine is taking in air, compressing it, and then expelling it. There is no ignition and usually no fuel, since the ignition is turned off. As a result, the compressed air in the cylinder after the piston has passed TDC 0° on the compression stroke act as spring and pushes down the piston. The greater the amount of air that was compressed in the cylinder the more powerful the "push".
Thus, the position and shape of the efficiency graphs on the area of decreasing crankshaft rotation with no ignition and opened throttle depends only on the mechanical (pneumatic) operation of the engine and does not depend on the state of the ignition system or the state of the fuel supply system.
This example was recorded on a carburettor equipped engine VAZ 2109 1.5 using external crankshaft transducer.
The efficiency of 3rd cylinder is decreased because of leakage.
Efficiency waveform of the 3rd cylinder at idle 1 is located below the black zero line. This indicates a significant reduction in the efficiency of this cylinder. The engine has a misfire. In other words the engine is "shaking".
According to this graph – during the time of decreasing crankshaft with full open throttle, and with the ignition off 8 – it is shown that as the engine speed goes down, the efficiency waveform of the 3rd cylinder deviates more and more down from the efficiency waveform of all the other cylinders. This character of the deviation chart indicates the reduced running compression in the given cylinder. Measurement of compression with compression test gauge in the conventional manner by using the engine starter gave the following results:
Cylinder 1= 12 Bar, Cylinder 2 = 14 Bar, Cylinder 3 = 7 Bar , and Cylinder 4 = 12 Bar.
Thus, the script "CSS" can accurately identify faults in the mechanical part of the engine; identify in which cylinder this fault is; variations in ignition timing and fuel delivery does not affect the measurement, because the ignition is turned off and combustion in the cylinders is not happening.
The "CSS" script can also identify intermittent and difficult to diagnose mechanical problems such as valves that are intermittently sticking open or closed.
A cylinder's power contribution depends on the quality and quantity of the air/fuel mix, the quality of the ignition spark and compression in each cylinder. It is important to note that comparisons of power contribution generated by different cylinders while the engine is operating can be used to conclude about the origin of failure - ignition system or fuel system.
Malfunction of the ignition system affect specifically on a cylinder's efficiency. – The cylinder may operate properly at idle, but not at all under load. This depends on the demand that is put on the ignition system.

Bad ignition coils, affecting on 3rd cylinder and 4th cylinder.
This example shows a malfunction in the ignition system for the 3rd and 4th cylinders, on the effectiveness graphs of the yellow trace and green trace it can be seen that the 3rd and 4th cylinders either operate in the same way as the 1st and 2nd cylinders, or they do not work at all 7 .
Thus, the failure in the ignition system lead to the fact that in different modes of engine operation the cylinder is either operating at full power, or does not work at all. Partial efficiency of the cylinders when the misfire is not occurring (except for rare failures of the ignition system when the ignition timing angle in one of the cylinders is significantly different from the other cylinders) is generally not ignition system related.
A partial deterioration of the efficiency of a given cylinder can be caused by lowered compression, the wrong air/fuel mix and incorrect composition of air/fuel mix for that cylinder. The next example was obtained on a VAZ 2115 1.6l 8 engine.
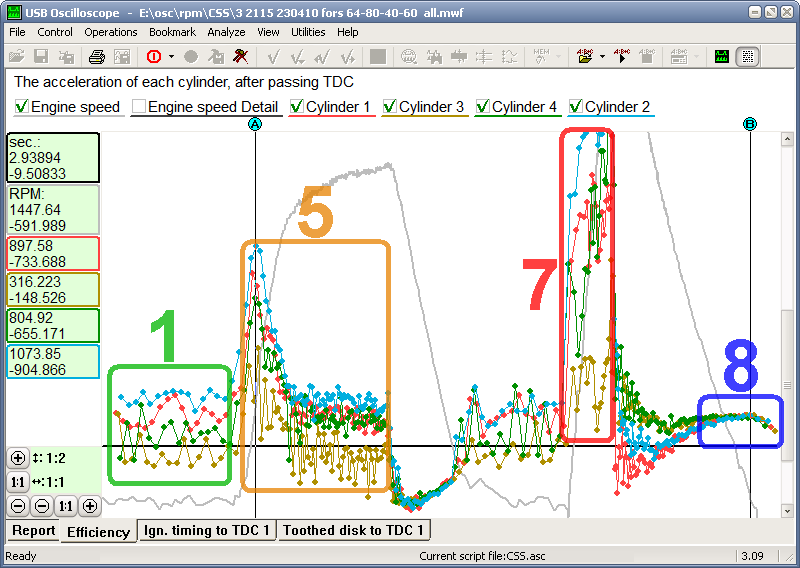
Dirty injectors
When at idle 1 this engine has a distinct misfire, during snap throttle 5 , 7 shows irregular operation.
Here the last phase of the efficiency graphs 8 shows that the mechanical condition of the engine is acceptable. At on different engine speeds the compression and cylinder fill is the same for all cylinders. The fact that on different engine operating modes the efficiency graphs show not complete, but only a partial reduction of the cylinder contribution indicates that the fault is outside of the ignition system. The engine's mechanical operation is correct, the ignition system operation is correct. By process of elimination, the reason for failure is improper fuel delivery, and so the fuel delivery system is at fault.
In this case, measured flow rate of the injectors on a test stand during 30 sec yielded the following results:
- 64 ml for cylinder №1 – red graphic
- 80 ml for cylinder №2 – blue graphic
- 40 ml for cylinder №3 – yellow graphic
- 60 ml for cylinder №4 – green graphic
Thus, if the last phase of the efficiency graphs indicate good condition of the mechanical part of the engine, and during engine operation in different modes, there is no complete loss of cylinder contribution, but just reduction in its efficiency in comparison with other cylinders, it indicates a malfunction of the fuel supply. Using this method it is possible to identify a partial contamination of the fuel injectors in the early stages, before it becomes a detectable misfire.
It should be noted that if the engine is equipped with two spark plugs per cylinder and only one of the spark plugs have a spark, the power contribution from that cylinder could be reduced by 10…20%.
The "CSS" script can serve as a good tool to aid in the diagnosis of an intermittent misfire and/or a rough running engine. However, it should be noted that in cases with complete loss of the cylinder(s), the script can not detect the origin of failure – ignition system or fuel system.
However, if a cylinder has zero power contribution during testing, but “comes to life” if another source of fuel is introduced in to the intake manifold, the cause is fuel system related. Most likely a plugged or non-operating injector.
The script cannot in and in itself identify whether it is an ignition or a fuel delivery problem that is the cause if a cylinder has no power contribution at all.
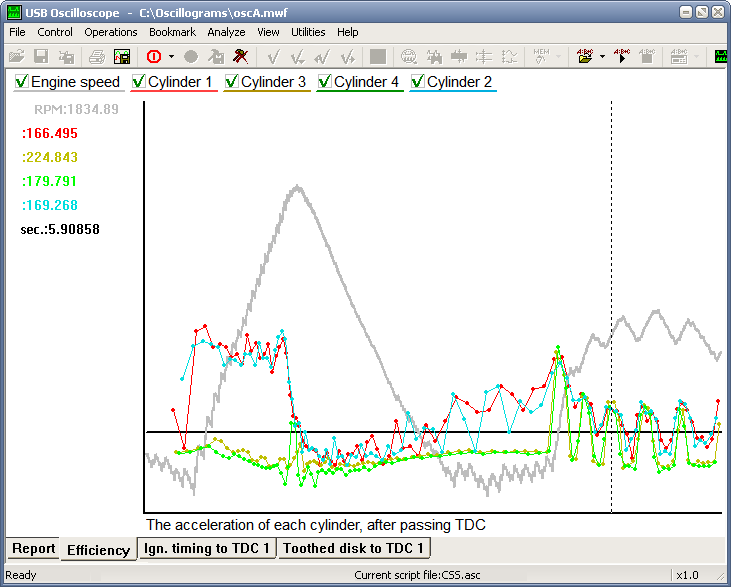
Addition of fuel into the intake engine manifold on an engine with heavily contaminated fuel injectors
Adding additional fuel provides combustion in cylinders serviced by very "dirty" injectors – at this time they started to work
The “Ignition timing” Tab
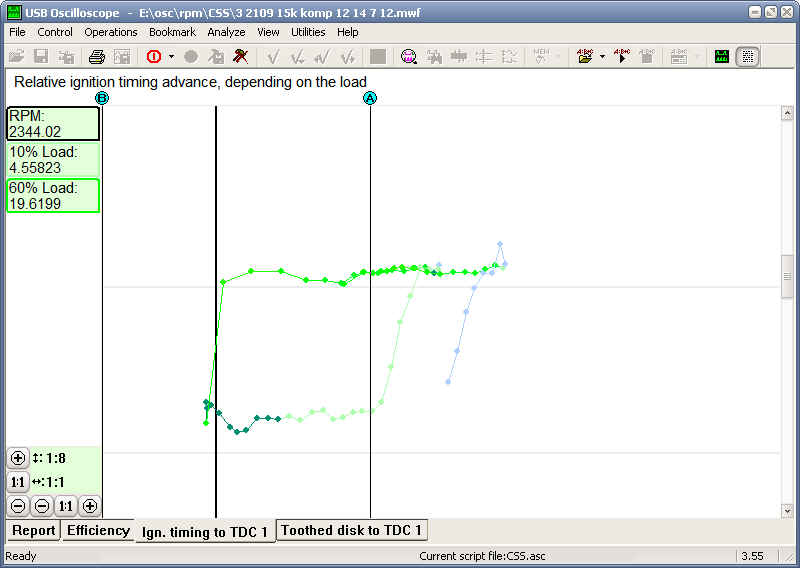
Script "CSS" calculates and displays in the tab "ignition timing" a graph that shows dependence of ignition timing from frequency of crankshaft rotation and from load on the engine. The engine speed is displayed horizontally, while the vertical displays the engine timing. The color of the graph is a representation of the load that is placed on the engine. A warmer color means higher load.
- Blue – minimum load
- Green – the medium load
- Yellow – the high load
- Red – the maximum load
The graph below shows a correct ignition timing map from a Lada Kalina.

The graph shows correct ignition timing on good engine.
It is seen that the graph has an inclination to the right and up. This is an indication that the higher the engine speed the more advanced the ignition timing is.
A piece of graph in red (maximum load) in this case corresponds to a rapid acceleration of the engine due to a full throttle snap. A piece of graph in green (medium load) in this case corresponds to a slow acceleration of the engine due to smooth partial throttle opening. The location of the red graph under green graph indicates that the ignition timing at full load is considerably less than the ignition timing at high load.
The following example was recorded on the carburetor engine of the VAZ 2109.
There is no correction of ignition timing depending on the speed of engine crankshaft
It is seen that the graph does not tilt to the right and up. It indicates that with increasing engine speed ignition timing is not advancing. This problem was caused by the weights of the centrifugal advance mechanism not working correctly. The vacuum advance mechanism is working correctly, however.
This tab is similar to the graph that builds the “Px” script. However, we should pay attention to the fact that the “Px” script calculates the absolute value of ignition timing. That is, if the “Px” script calculates the value of the ignition advance angle to be 10°, it is exactly that. In contrast, the “CSS” script calculates the value of ignition timing relative to the value given by the technician with regard to the initial ignition timing. That is, calculated by "CSS" script values are relative. Therefore, setting the initial ignition timing on this graph can not be performed. In the tab "Ignition timing" the “CSS” script is marking a level corresponding to the ignition angle of 0° on the horizontal axis, it is shown in grey so that the technician remembers that this position is not absolute and depends on the initial ignition timing, value which the technician himself entered when starting the “CSS” script . On this axis, also in Grey, the value of the ignition timing as entered by the technician is shown.
Even though the resulting graph of the “CSS” script is relative, the shape of this graph is correct. The leakage of the vacuum diaphragm mechanism correct ignition timing and/or incorrect operation of the centrifugal mechanism for regulating ignition timing easily diagnosed in the tab "Ignition timing".
The “Toothed disk” Tab
The "CSS" script automatically determines the number of teeth and gaps on reluctor wheel as well as their location respectively to TDC of the timing cylinder. Also, in the tab "Toothed disk" graphs that show characteristics of the toothed disc and crankshaft sensor are displayed.

This example is recorded from a VAZ 2107 engine, equipped with fuel injection
The black graph shows presence/absence of teeth. In this case there are 2 missing teeth in the 120° before TDC 0°.
The red graph shows the distance deviation between the teeth. If the distance between the teeth is varying (due to a bent or broken tooth for example), the deviation will be shown. Also, a bent or otherwise deformed flywheel will show here. If the distance deviation is more than 2%, the red graph will be outside the pink area 1 .

Teeth of the toothed disk are broken


On some engines, parts of the signal from the speed/position sensor for the engine crankshaft is formed by slightly distorted and biased teeth instead of the tooth or teeth completely missing.. As a result, the corresponding section of the graph in red is distorted. This is a consequence of the design features of the toothed disk and crankshaft speed/position and it is not a malfunction.
In 1, 2, and 4 cylinder engines the red graph will have a cyclic, almost sinusoidal variation. This is because all the cylinders will be at their dead center simultaneously. At this moment in time all kinetic energy is accumulated in the flywheel and crankshaft. Because of this, even without a load on the engine the crankshaft rotation is not uniform and the change in speed is is recognized by the "CSS" script as a small deviation of the position of the teeth. For 3, 5, 6-cylinder engines and more, the nature of the crankshaft rotation is more uniform.
The green graph shows the signal strength from the crankshaft position sensor, and it is compensated for the varying strength of the signal due to speed variations. The calculated signal strength as shown is therefore a relative value and it depends on the sensor itself, the toothed disk, and the distance between the sensor and the teeth on the toothed disk. If the green graph is inside 2 of the black graph the air gap between the sensor and flywheel may be too large.
In the image below the green graph clearly shows bad center of the toothed wheel.

Bad center of the toothed wheel
This example is recorded from an Alfa Romeo 146 1.4 Twin Spark.

Toothed disk Alfa Romeo 146 1.4 Twin Spark
The manufacturer accuracy of the teeth is low and the distance deviation between the teeth is in the range of ±2%. The missing teeth are located closer to the TDC.
It should be noted that the graphs in the "Toothed disk" tab show only the permanent faults associated with the specific toothed disk. If the signal from the crankshaft position sensor is intermittently distorted, it will only affect the graph of instantaneous engine speed in tab "efficiency" in the form of distortions of this graph.

Intermittent distortions of the engine speed graph due to an unreliable electrical connection
Here the signal from the crankshaft position sensor is distorted because of an unreliable electrical contact.
